Understanding Data: FREE Mean Median & Mode Lesson
Looking for fun, unique, hands on way to introduce and explore measures of center? This FREE mean median & mode lesson uses pennies to analyze and compare measures of center.
Gathering data and then knowing how best to analyze and summarize that data is an important mathematical skill. In this lesson, students use a handful of pennies to explore different measures of center (mean, median and mode) and discuss what might be the best for their data set.
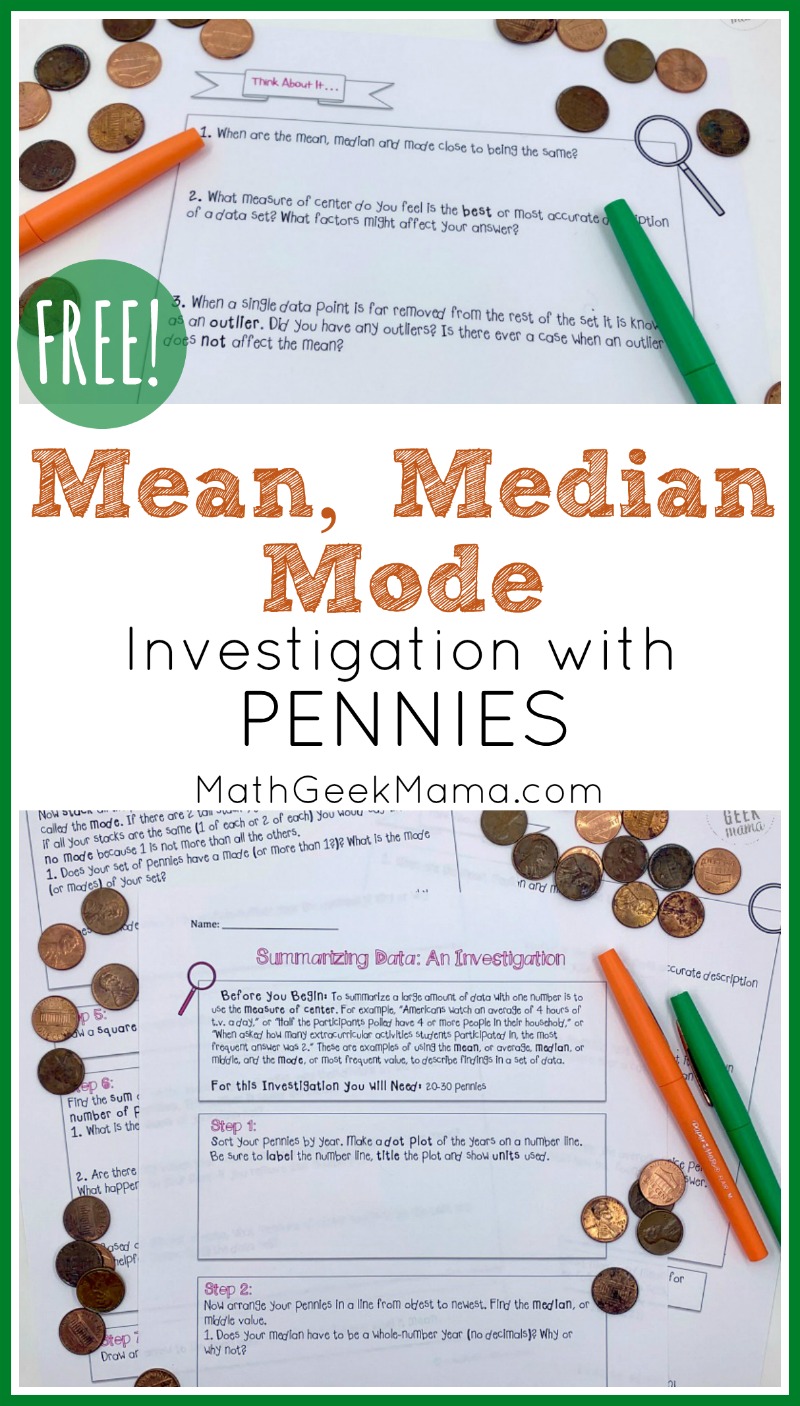
Materials Needed for Mean, Median Mode Investigation:
- Handful of pennies from various years (20-30 pennies)
- Student handout (download at the end of this post)
- If you don’t have pennies, sample data sets are included, but actual pennies are ideal 😉
This step by step math investigation is meant to be an introduction to mean, median and mode, so no prior knowledge is necessary! This could be used with students in 5th grade and up.
Using the Mean Median & Mode Lesson:
This lesson walks students step by step through gathering, organizing and analyzing their set of data (the years of their pennies).
Once the pennies are in order, they look at the years to find the mean, median and mode and will see different ways to compare and analyze it.
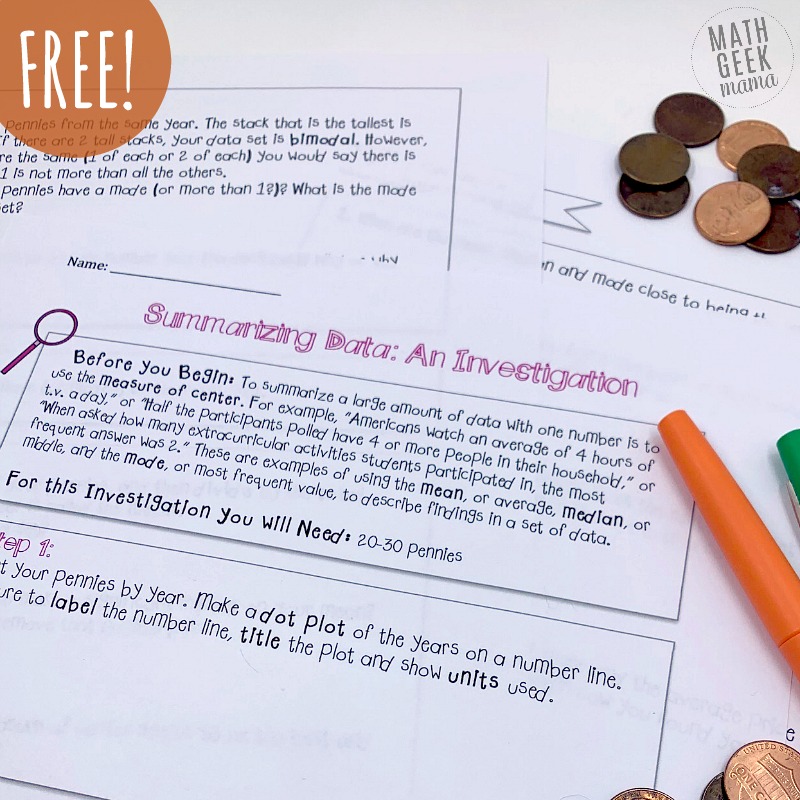
For instance, they begin by looking at a dot plot.
Later, they stack pennies to find the mode (the most frequent year will form the highest tower).
The mean median & mode lesson ends with discussion questions to help students understand the differences in these measures of center and consider which best fits the data. They will also consider outliers and the effect that might have on the different measures.
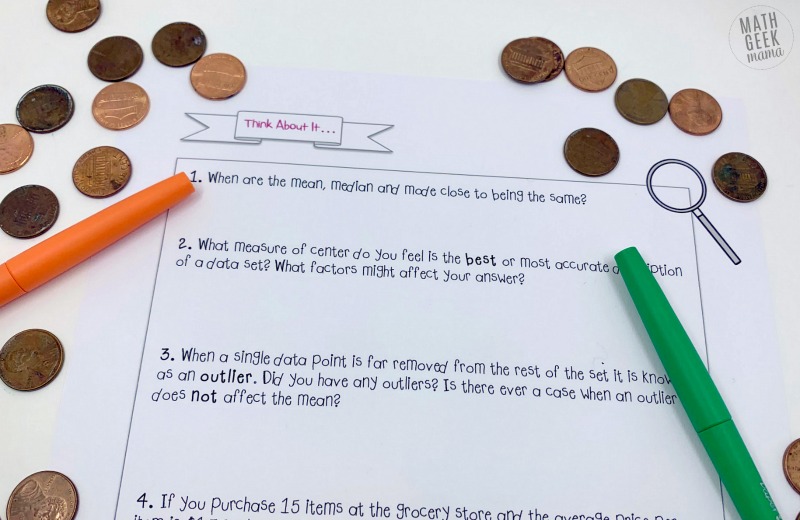
This lesson includes teaching tips, sample data and a student handout pages.
Lastly, the investigation ends with a few ‘practice your skills’ problems to put their newly discovered data skills to work.
{Click HERE to go to my shop and download the Mean Median & Mode lesson!}
I hope you will find this lesson useful!
Looking for Data Analysis for Younger Ones? Try One of These Ideas:
You might also like these more in depth data analysis resources:
- Data Analysis Graphing Calculator Lessons | Grades 6+
- Data Analysis in Grades K-2 | 8 Different Themes to Explore




I’m glad you are the Featured Freebie this week on TBA. I missed this last week and it is perfect for my students. Thank you.
I’m so glad you found this helpful Mary! Thanks for stopping by! 🙂
Thanks so much! I can’t wait to use this lesson for my students!
Great! I hope it goes well! 🙂