

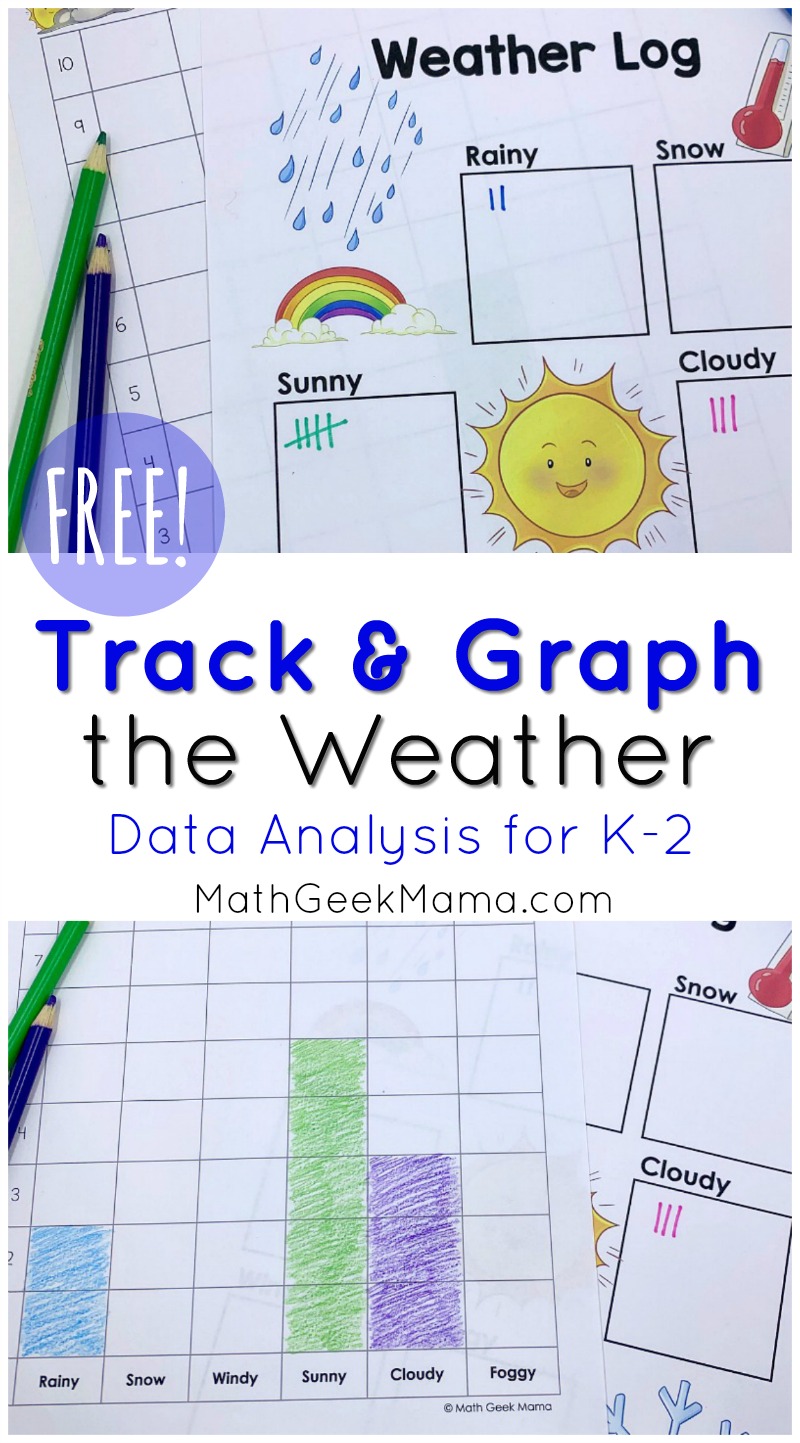
{FREE} Track the Weather: Tally, Count & Graph Activity
Looking for a way to combine math & science? Explore the weather and practice skills such as tally marks, counting, graphing and more with this free weather graphing activity for grades K-2.
Do you have a daily calendar time with your students? Or do you teach a unit on weather and different types of weather, seasons or clouds? This simple math activity is sure to fit right in and engage your kids in meaningful, real life math. And because the weather can vary so much depending on the season, this is a great one to pull out several times throughout the year to see how the answers change! I hope you have fun with this track the weather graphing activity! This is a simple introduction to collecting and analyzing data in grades K-2.
*Please Note: This post contains affiliate links which support the work of this site. Read our full disclosure here.*
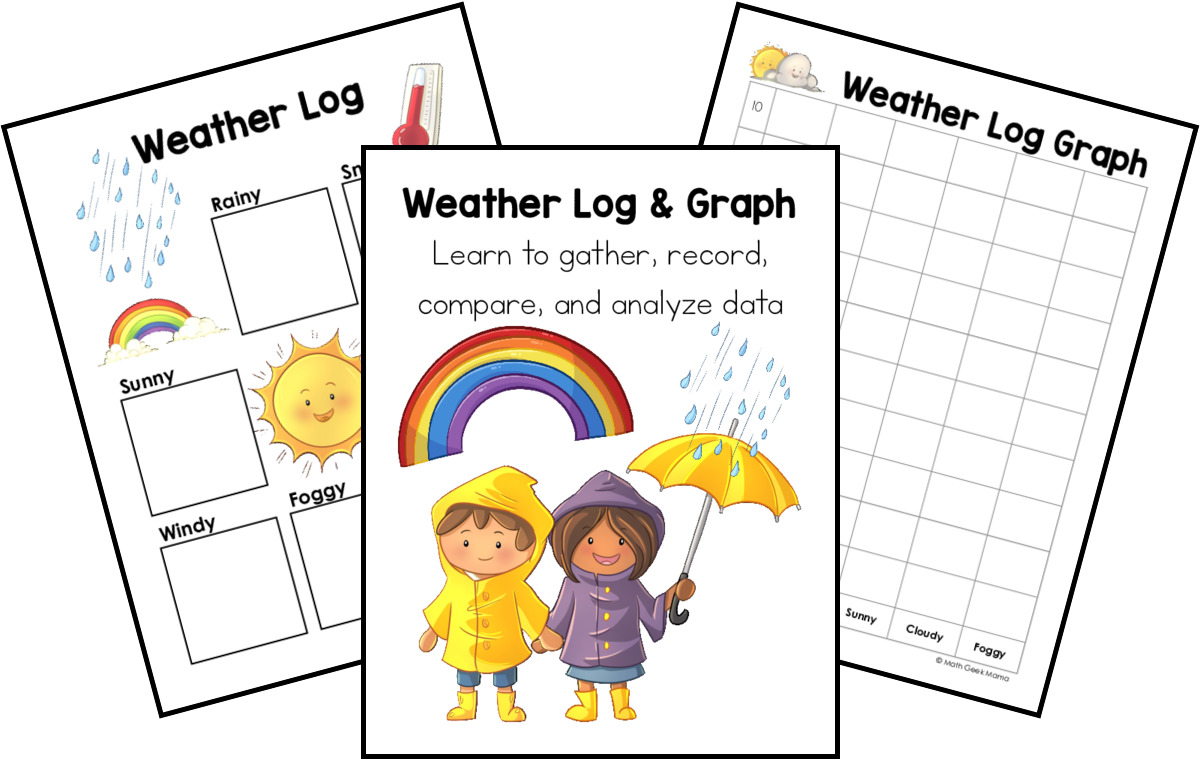
Included in the Download:
This free weather graphing activity includes everything you need to engage your students.
- Teaching tips and instructions page
- Data analysis questions to guide meaningful discussions about the data
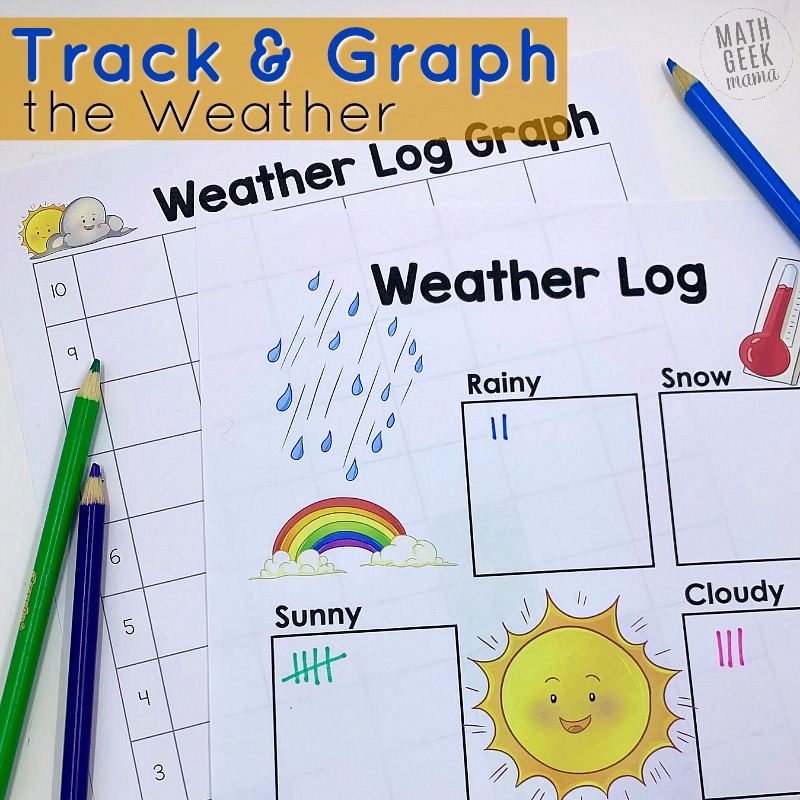
- Tally/data collection page
- Data graphing page
How to Use This Weather Graphing Activity:
This real life math challenge is super simple to use with your students, but they may need some help or a refresher on using tally marks before they start.
For example, you may want to review what tally marks are, and how to create a group or bundle of five. You can then practice counting groups of tally marks, especially groups of five. This is a fun way to review skip counting as you prepare for this data collection activity.
Once kids feel confident using and counting tally marks, you give them the data collection sheet.
They will use this to mark the weather once a day for 1-2 weeks.
I recommend they mark the weather at the same time each day (such as when they wake up, or as soon as class starts, if you are doing this in the classroom). That way their data will be consistent, because we all know that they weather can change on a dime!
Be sure to tell them there’s no need to mark multiple weather categories within the same day, even though the weather can change.
After a week or two of collecting data, it’s time to graph it!
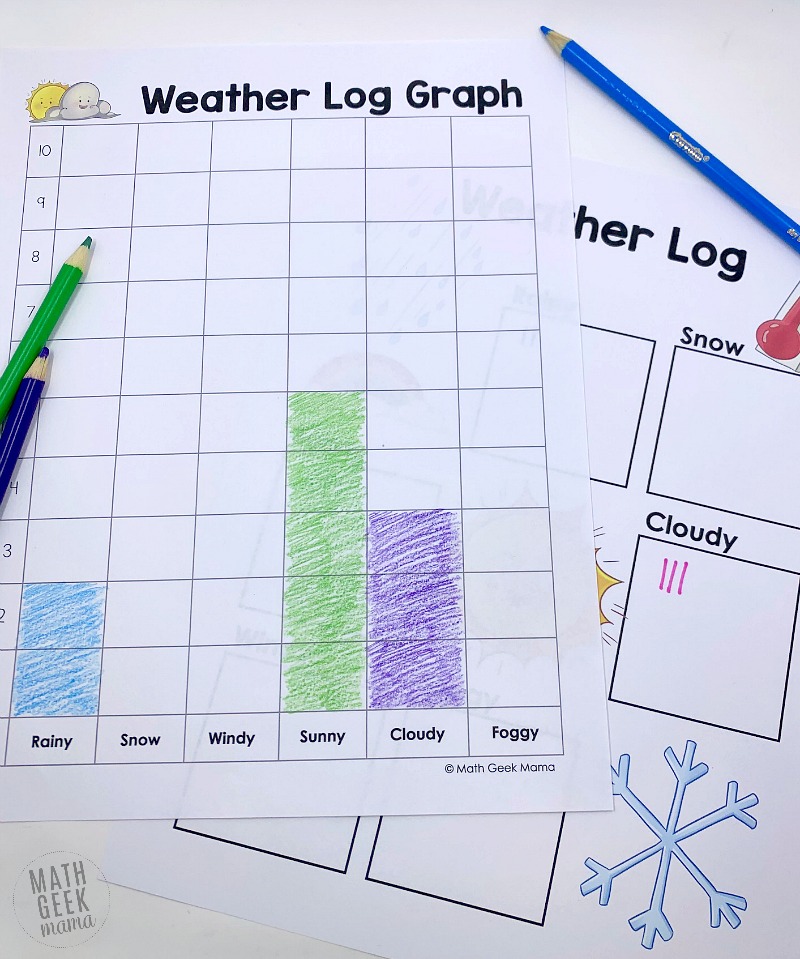
You will then need to give students the weather graphing page, where they can color a bar graph to show the total types of weather.
Analyzing the Weather Data:
Once students have their graphs, you can discuss it together as a group, or let students discuss and compare with a partner.
There are discussion questions included to get you started, but obviously you can tweak your conversation to tailor it to your students.
Some questions to consider:
- Why might students have different data if they were collecting it on the same days, in the same town? (they may have gathered at different times of day, some might have subjectively different ideas of what ‘windy’ means, etc.)
- Why are there ‘zero’ days for some types of weather, such as snow?
- How does the season affect the data? How might their data change if they were to complete this again in 3 months? 6 months?
I hope this provides a unique and engaging math challenge for your little learners! If you are looking for more topics to consider and data to collect, you might enjoy my data analysis set for grades K-2!
This includes 8 different themes/topics for kids to poll their friends and family to collect data. Each theme includes discussion questions, data collection page and graph, allowing you to revisit these skills throughout the year with different topics.
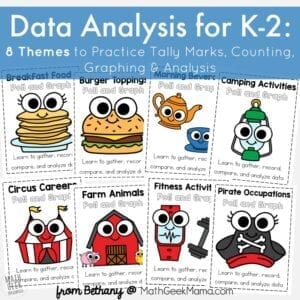
Learn more about Data Analysis for K-2 HERE!
Ready to snag this weather graphing activity freebie? Simply click the link below to go to my shop and grab this free set.


One Comment
Comments are closed.