
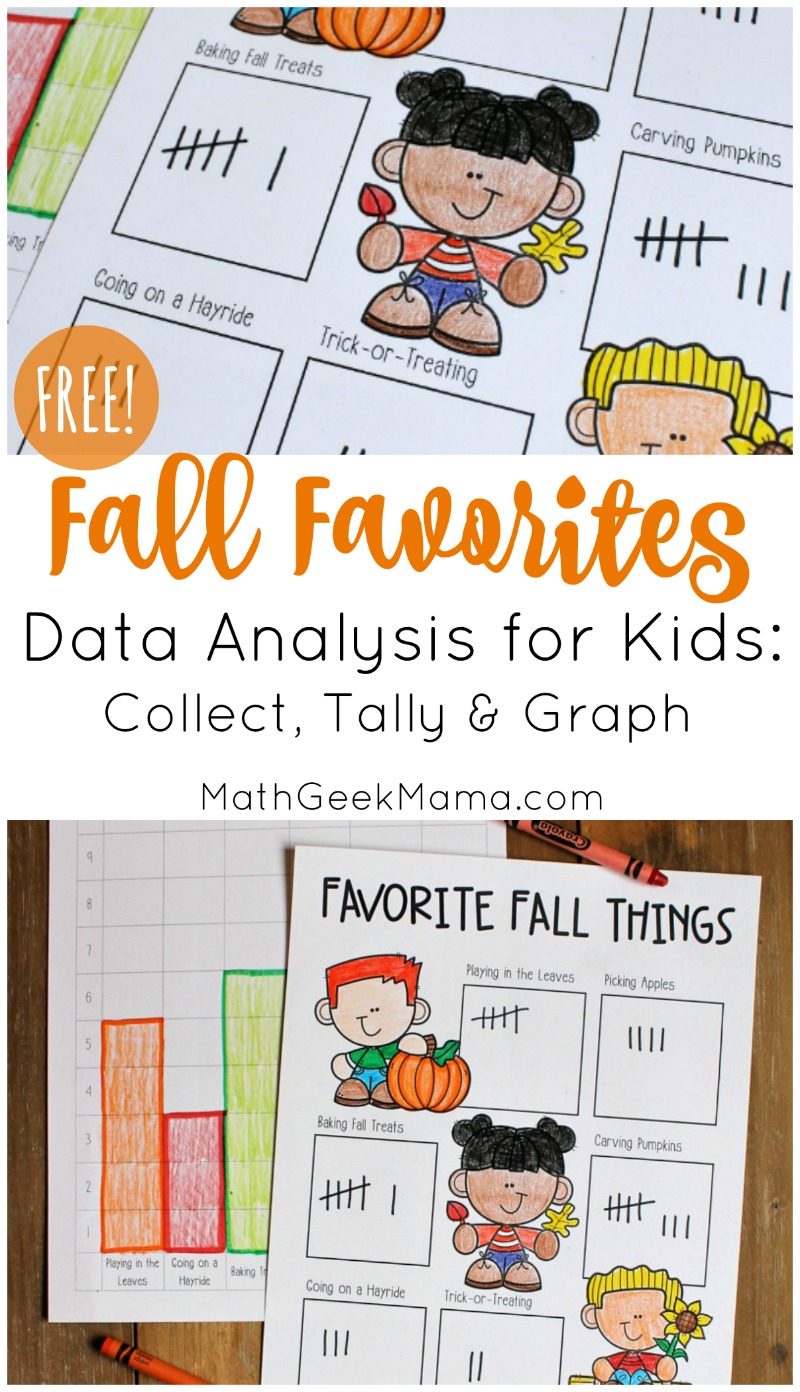
Fall Favorites: Simple Data Analysis for Kids {FREE}
On this site you will find dozens of fall math ideas, games and activities for kids of all ages because it is one of my favorite times of the year. Today I’m adding to the fall math collection with a simple, yet engaging data activity for kids. Collecting, graphing and analyzing data is an essential math skill because kids will use this throughout their school career and even in their everyday lives. They need to be able to understand graphs and interpret the information correctly. Beyond that, they should be able to draw conclusions based on the data they see. Our world is full of data, statistics and graphs, so this data analysis lesson for kids will give them the perfect introduction.
*Please Note: This post contains affiliate links which support the work of this site. Read our full disclosure here.*
Getting Ready for the Lesson:
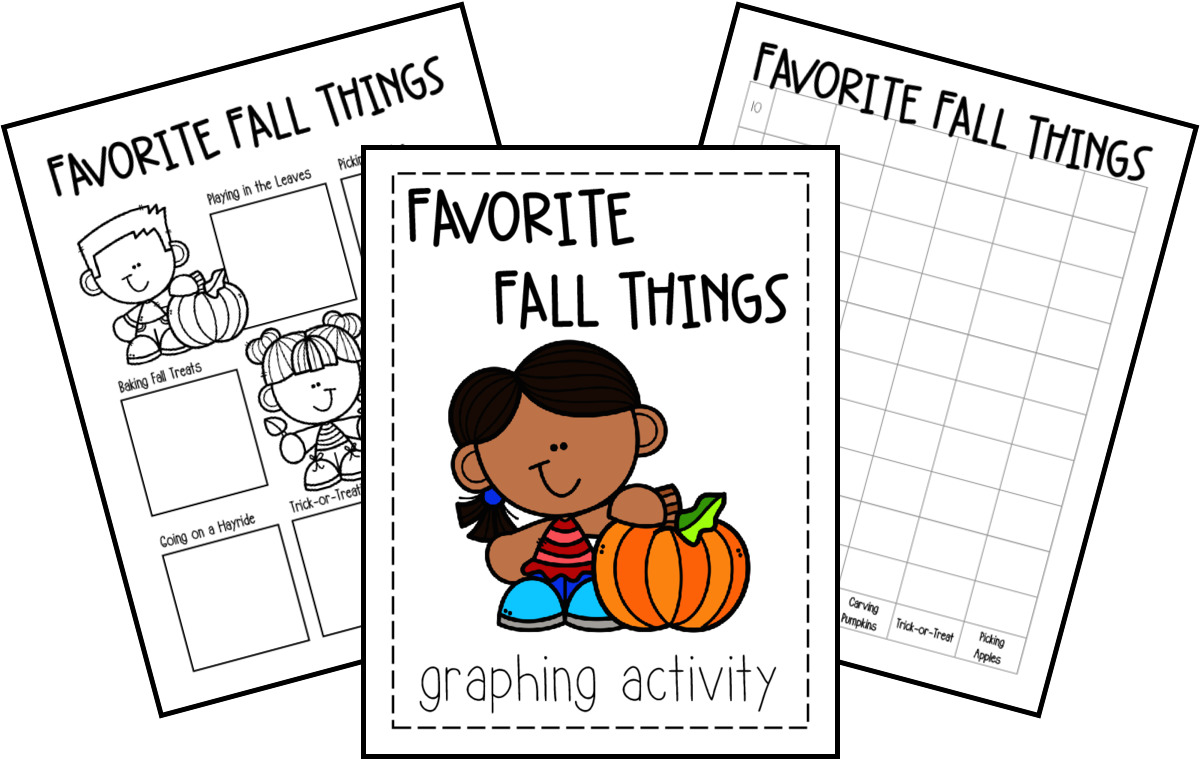
If you have young kids, I suggest beginning with a class discussion about fall activities. Ask what they like to do in fall and see how many ideas they come up with. Maybe even include this as part of your calendar time to lead into the math lesson.
Kids will probably come up with more ideas than what’s included in this lesson, so encourage them to extend their data or create another collection with more choices afterwards.
In order to collect data to graph and analyze, kids will need to know how to use and count tally marks. If your kids are not confident with this yet, you’ll also want to begin with a discussion on tally marks and practice counting together.
Using tally marks provides kids with great counting practice, especially counting by 5 and counting on. If you have young kids, you may want to break this lesson into two days: on day one, talk about and practice tally marks and favorite fall activities. On day two, let them collect data and graph.
Data Analysis for Kids:
Once kids have an understanding of tally marks and the basis for this math lesson, they’re ready to begin collecting their data.
One thing you’ll want to note is that students should have those they survey only pick one favorite thing. Or for a larger sample, each person could pick two favorite things. Just be sure that everyone completes their tally in the same way.
You can then collect data several ways. If you want them to complete it in class, you could tally every student and keep track together as a group. This way, all students will have the same data to graph and discuss.
Another idea, for kids who are ready for more independence, is to let them complete it in class and require every student to talk to 10 kids. Doing it this way will give every student a different set of data.
Another option is to have kids do the data collection at home, surveying family and friends. Again, this will then give each student different data to graph.
However students collect their data, they complete the assignment by graphing the data (included in the download) on a bar graph.
Once everyone has collected and graphed their findings, you can discuss it together and compare!

Questions to Ask About Fall Favorites:
Depending on the age of your students (and whether or not they have a single set of data or their answers are all different), there are a lot of things you can discuss together to analyze the data.
First, you might start by finding the most popular and least popular fall activities.
Then you could ask for combinations such as, “How many people like carving pumpkins AND trick-or-treating?” This will help kids practice addition.
For older kids who are ready, you can challenge them with “how many more” questions. For example, “How many more people like going on a hayride than picking apples?”
You could also discuss the ‘why’ behind their findings, meaning, “Why do you think trick-or-treating is the most popular activity?” Just be sure that students understand that the data only tells us what, not why. We can probably come up with some good hypotheses (i.e. kids love free candy & dressing up), but just from looking at our graph, we don’t know why.
If your students all have different data sets, you can also discuss differences and why larger sample sizes may be needed to draw better conclusions.
For instance, one student’s graph may show that carving pumpkins is the favorite, while another might show baking fall treats is the favorite.
It’s important for kids to see and discuss these differences and how it can affect their data.
Looking for more practice with these skills to use all year long? Try the complete set of 8 themes:
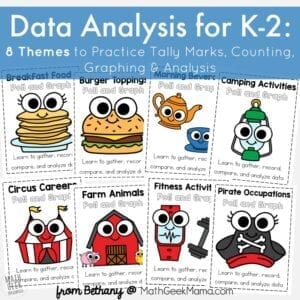
Buy Data Analysis for K-2 HERE
I hope you enjoy this fun fall math lesson!