Fidget Spinner Math Activity: Probability & Graphing
What are your feelings on fidget spinners? Some teachers love them, while others may not feel quite the same way. Whatever our feelings, most kids love them, so adding them to learning can be a good thing.
And that is exactly what these fidget spinner math activities do.
*Please Note: This post contains affiliate links which help support the work of this site. Read our full disclosure here.*
*This is a guest post from Rachel of You’ve Got This Math.
Materials Needed for Fidget Spinner Math:
- A fidget spinner (obviously!)
- A piece of tape or sticky note to mark the “pointer” on the spinner
- The fidget spinner math lesson download (scroll to the end of the post)
Graphing and Probability Fidget Spinner Math Activity
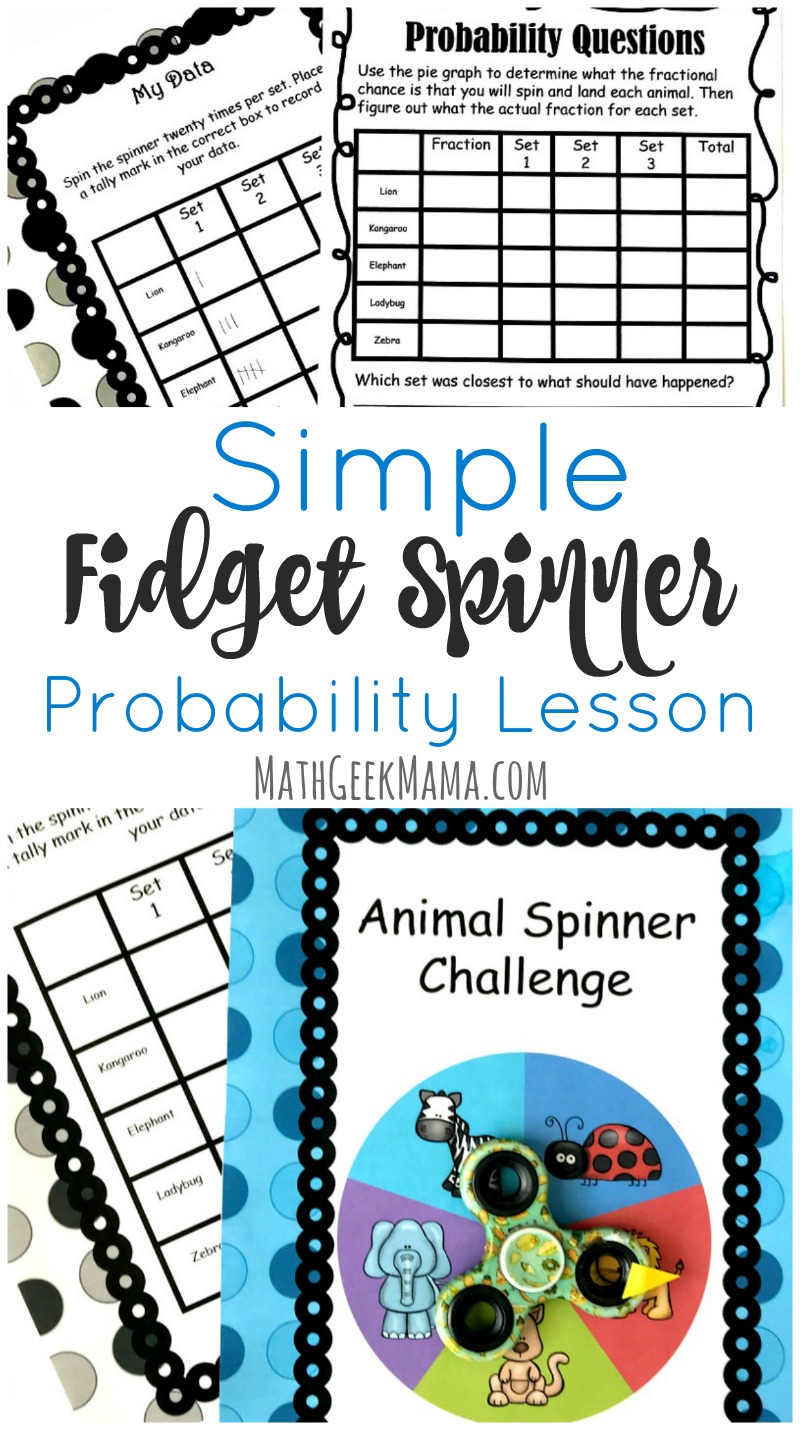
This activity starts with a fidget spinner and a chart with five animals on it. Kids are asked to spin the fidget spinner 20 times, and use tally marks to record the data.
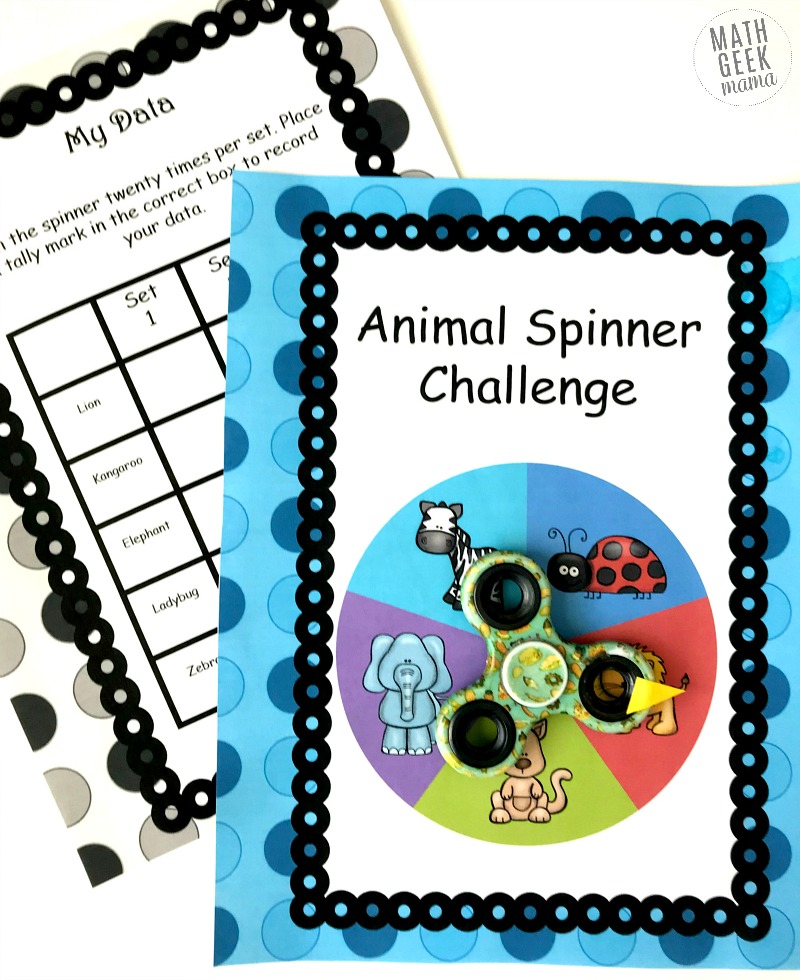
As an option, the can complete two more sets (spinning the spinner 20 times each) and also record that data on the recording sheet.
Introducing Probability:
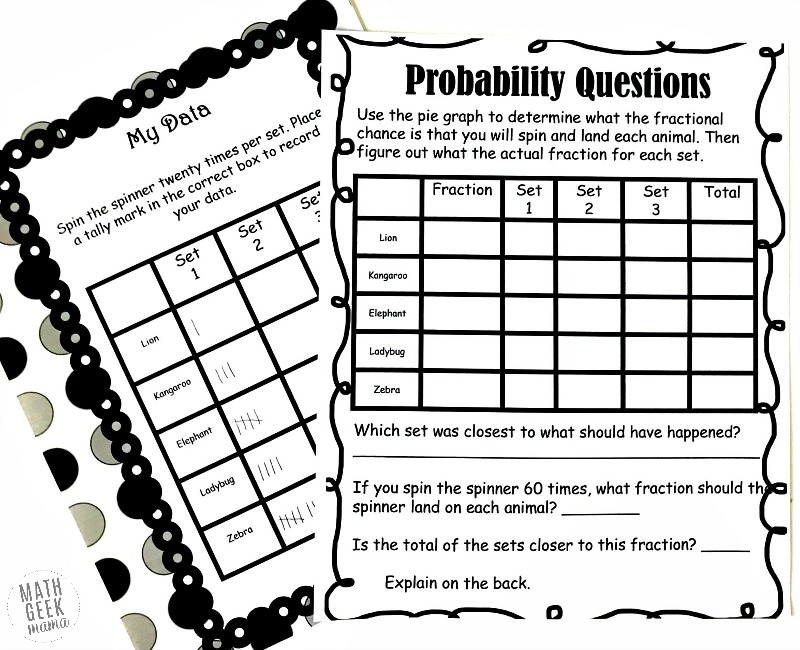
Now it is time to get in the probability part of the lesson. This first job is to figure out what fraction the spinner should have landed on each animal.
This is actually quite simple to figure out if your children use their fractional sense. The first step is to figure out what the whole is. There are five animals so the denominator is 5.
Now it is time to figure out the numerator. Each animal is only on the chart once so the numerator is 1.
There is, therefore, a 1 out of five chance that the spinner will land on a given animal.
You can extend the lesson by having them create an equivalent fraction.
If we are going to spin the spinner 20 times, how many times should it land on the lion?
The denominator is now 20. 5 x 4 = 20, so we will multiply 1 x 4 to get 4. 1/5 x 4/4 = 4/20.
So when the spinner is spun 20 times, we expect it to land on the lion 4 times.
They finish up this page by figuring out the fraction that the spinner actually landed on each animal, and then answering questions designed to have them analyze their data.
Related: Probability Coloring Pages
Graphing the Fidget Spinner Data:
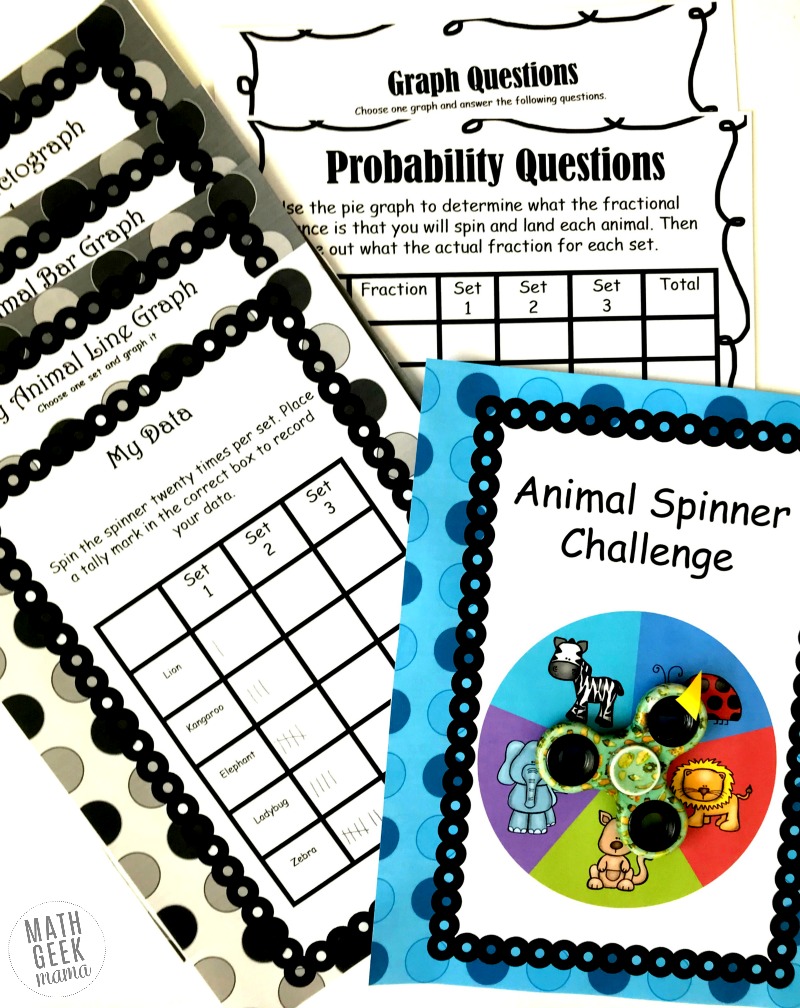
Now it is time to graph the data. The children use their recording sheet to create three different types of graphs.
Line Graph:
The first graph is a line graph. The children use one of the sets and record their data on the graph, and then use a ruler to connect the dots.
Bar Graph:
Next, they move into bar graphs. Have the children grab some colored pencils, and then color in the spaces to represent how many times each time the spinner landed on an animal.
For example, if the spinner landed on the ladybug three times, they would color three rectangles above the word ladybug.
Pictograph:
We end our graph creations with a fun one: pictographs!
For this one, the students have to decide what picture they want to use to represent the animals. Once they decide, it is important for them to realize that the picture will represent two.
This means that if the spinner landed on the zebra four times, they would draw their picture two times.
If the spinner landed on the kangaroo five times, they would have to draw the picture 2 1/2 times.
Once all the graphs are done, it is time to analyze them. There are few questions for you to end the activity with. These require your kids to study their graphs for the answers!
Even if you are not a fan of fidget spinners, I hope you and your children have a wonderful time using them to work on probability and graphing.
You’ve Got This
Rachel
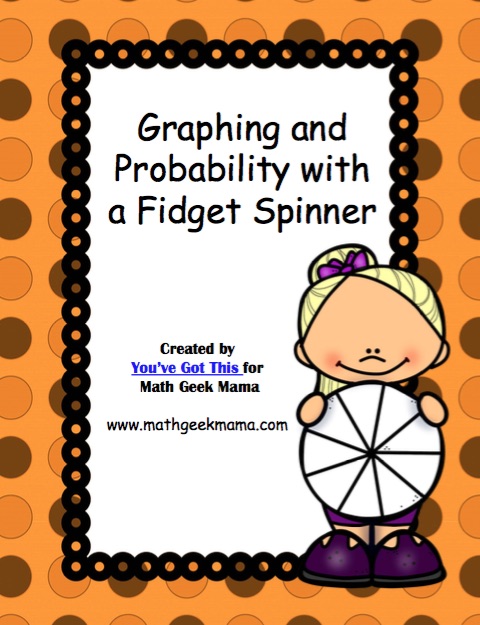
{Click HERE to go to my shop and get the FREE Fidget Spinner Math Activity!}
Rachel is a homeschool mom to four little ones, ages 2 to 6. She is a former public elementary teacher, and has recently begun blogging at her page You’ve Got This. You can also find her on Facebook and Pinterest.




2 Comments
Comments are closed.