

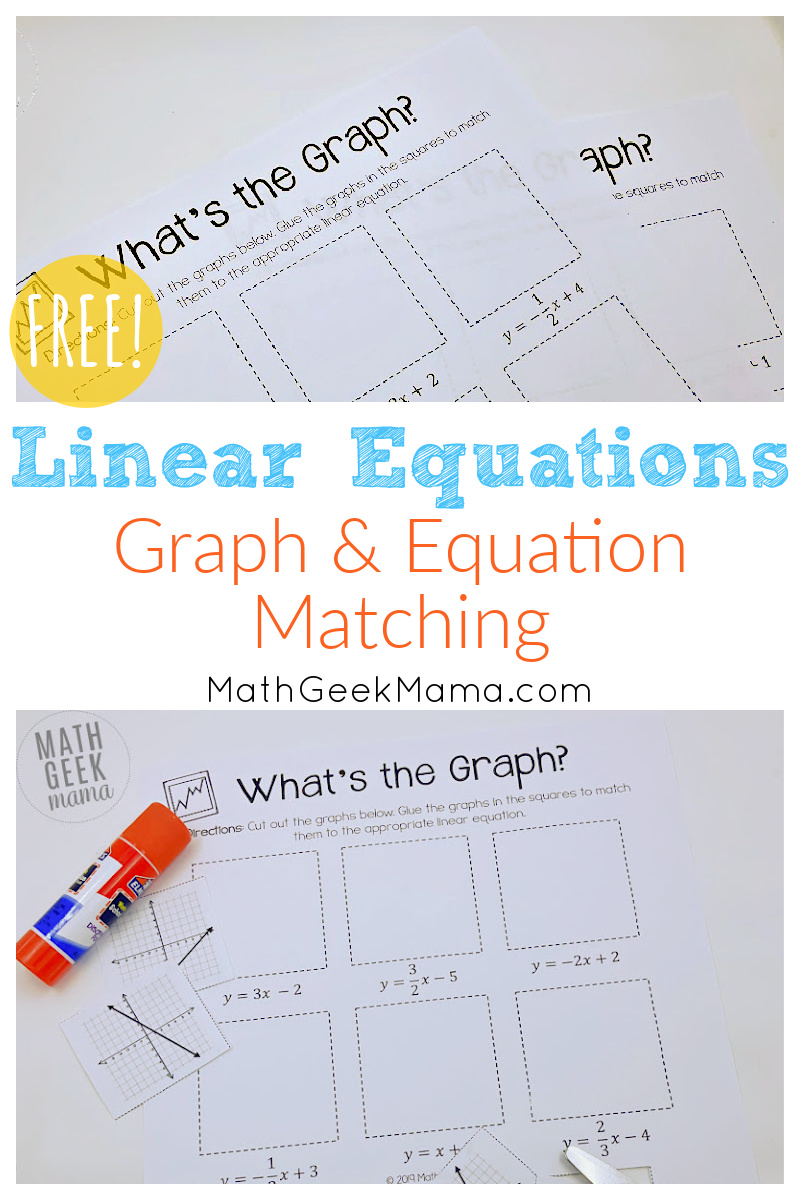
Graphing Linear Equations: Cut & Paste Worksheets {FREE}
Want to help your students better understand the relationship between a linear equation and it’s graph? Grab this set of low-prep, graphing linear equations worksheets to practice and make sense of linear equations.
One of my biggest goals when teaching Algebra–whether it is in the classroom with middle schoolers, reviewing with high school students or teaching my own kids as we homeschool–is to help kids visualize Algebra and see the connections between words, tables, graphs and equations. The last thing I want is for students to think of graphing a linear equation as an independent skill, devoid of meaning and unrelated to everything else that they’re learning. Because it’s not! Understanding the graph of a linear equation and how it relates to a particular context, then seeing the points in a table and tying all that to the equation leads to deep understanding. Not just rote memorization. Not just following steps mindlessly so they can get by. But actual understanding that shows how we see and use Algebra in the real world everyday.
So to that end, I like to do a lot of matching activities and sorting challenges to force students to consider how all these pieces fit and work together. This set of super low-prep cut and paste worksheets is just one example, but I hope it helps your kids practice graphing linear equations while also looking for connections between the equation and the graph.
Materials Needed:
- Linear Equations Worksheets
- Scissors for each student
- Glue sticks
Prep Work:
To get ready to use this, simply print out the worksheets you want to assign to students. There are three included in the download (link at the end of this post), so feel free to use them however you like.
Print enough worksheets for all your students, pass out scissors and glue sticks and you’re all set!
Easy peasy!
Using the Graphing Linear Equations Worksheets:
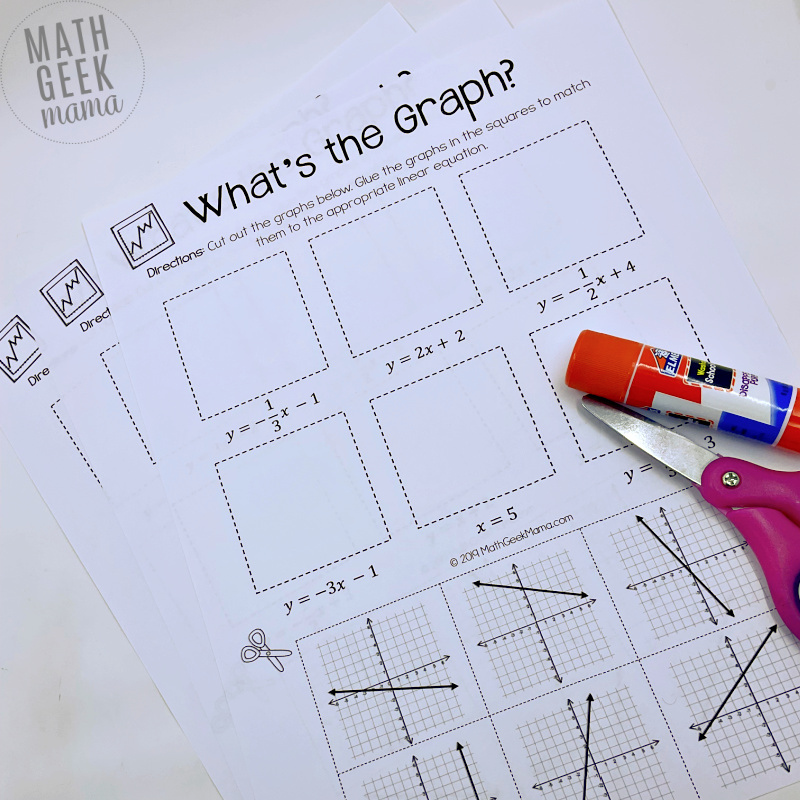
To begin, students cut out the graphs at the bottom of the page. They then glue the graphs above the corresponding linear equation.
Before your students start, you might want to discuss strategies together as a group. For example:
- Make a table of values for each equation, then match those to the corresponding graphs
- Look at the slopes to determine if they’re positive or negative and narrow down possible graphs
- Use the y-intercept to narrow down the possible graphs
If your students are unsure of where to begin, provide some blank graph paper and encourage them to graph one of the equations on their own.
Although creating a table of values and then plotting each point on a separate graph until you see a matching graph may seem tedious to you, this might be where some students are most comfortable.
Give them time to make the connections between the y-intercept and slope seen in the equation with where and how those values are seen in the graph.
With more practice and exposure, they will eventually grow in confidence and be more comfortable with using the y-intercept as a starting point!
Ideas for Incorporating These Practice Pages:
Although you can use these however you want, here are some ideas of when to assign these low-prep practice pages.
- A warm-up for 3 days in a row
- Extra practice
- Review before a test
- Homework assignment
- Simple sub plans to keep on hand
You will also find answer keys for all three pages in the download, making it super easy for you to check students’ work, or for them to check their graphs themselves.
I hope this is useful for you and enjoyable for your students!
To grab your free printable, use the link below to grab the download in my shop.
{Click HERE to go to my shop and grab the FREE Graphing Linear Equations Worksheets}
More Resources to Explore Linear Equations:
- Linear Equations Puzzles: Free Practice Set
- DIGITAL Solving Linear Equations Error Analysis {FREE}
- Christmas Graphing Challenge: Graphing Linear Equations


One Comment
Comments are closed.