
Valentine’s Day Tally, Count & Graph: Grades K-2
Weave in a variety of math skills with this Valentine’s Day data analysis activity! Kids collect data and keep track with tally marks, then count, graph and analyze the results.
At my house, we call Valentine’s Day, “Just Because I Love You” Day. It’s a chance for me to show my kids that I love them and more importantly, that God loves them. It’s not a big to-do, just a fun chance to do a simple craft (courtesy of the Target Dollar Spot, usually), and some Valentine’s Day learning activities during school. This simple activity is a great way to review various math skills for grades K-2, and get kids talking about their favorite Valentine’s Day Activities at the same time. This is a great opportunity to include some early data analysis as well as graphing practice!
*Please Note: This post contains affiliate links that support the work of this site. Read our full disclosure here.*
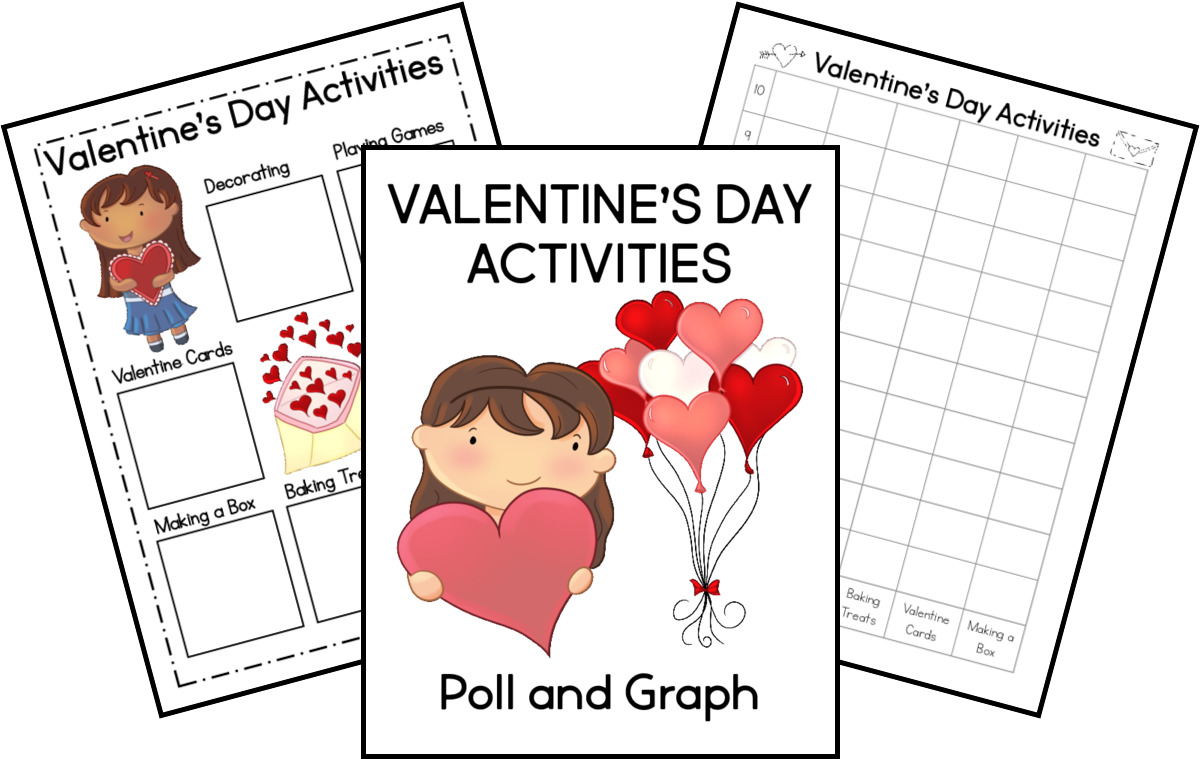
Included in the Valentine’s Day Data Analysis Download:
- Tally page for kids to poll their friends (in color & black and white)
- Set of discussion questions to dig deeper into the results
- Graphing page for kids to show the results on a bar graph
Setting up the Activity:
Getting kids ready for this activity is super easy, and doesn’t require any fancy supplies. All you need is a tally page and graphing page for each student.
They will then need colored pencils or crayons to color their graph.
That’s it!
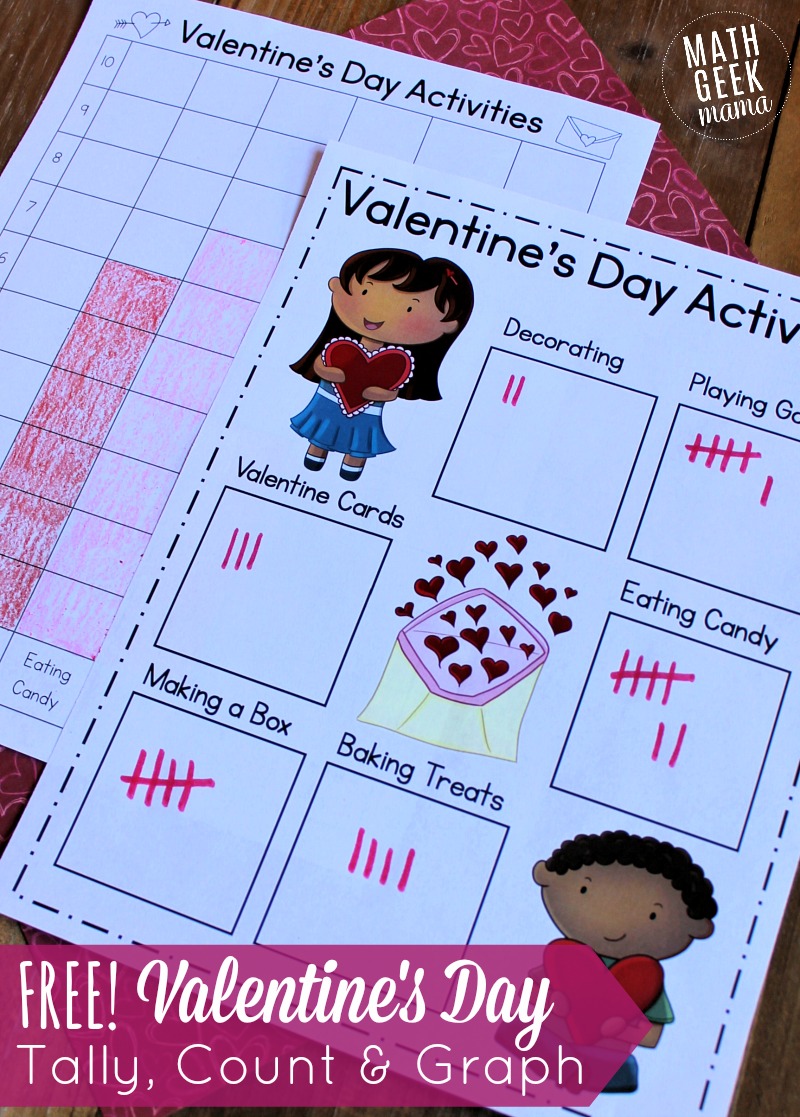
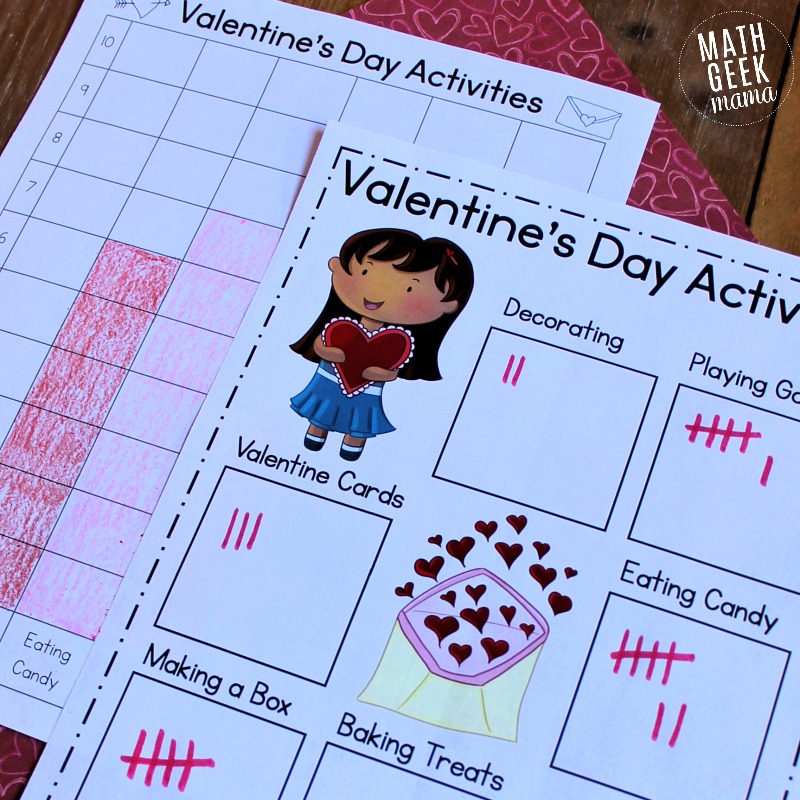
Valentine’s Day Poll & Tally:
Students begin by polling their friends about their favorite Valentine’s Day activity. Do they prefer to make a box for their cards or hand out special cards to their friends? Do they prefer decorating with hearts or baking special treats?
Students then use tally marks to keep track of all the answers. I suggest they poll 10 students (or family members or friends, if they complete the collection outside of class).
If this is a new math skill for your kiddos, I would practice using tally marks and then counting groups of tally marks before you begin this data collection and analysis. They need to feel confident with tally marks before they can count and graph the data.
Graphing the Data:
Once kids have a good collection of data, they color in their bar graph to show the total for each activity.
This will help them to practice graphing, but also provide a great visual for their data. This visual will help them to easily analyze the information and compare quantities.
If each student completes the data collection and graphing independently, they can then compare their graphs with others to see if they have similar findings.
Analyzing the Valentine’s Day Data:
Lastly, there are a variety of discussion questions included that you can use to help kids practice reading their graph, compare quantities and form reasonable conclusions.
The answers will vary, depending on the results of the data. This provides for interesting math discussions, though, as your kids realize that polling 10 different people can give you very different results!
And of course, the included discussion questions are just a guide for you. Use these as a springboard to help you come up with other questions, that are meaningful to your students and the data they collected.
Most of all, have fun with this Valentine’s Day math activity for grades K-2!
Data Analysis for Grades K-2:
If you love the simplicity of this activity and wish you had more themes to use throughout the school year, you may like my complete collection for grades K-2!
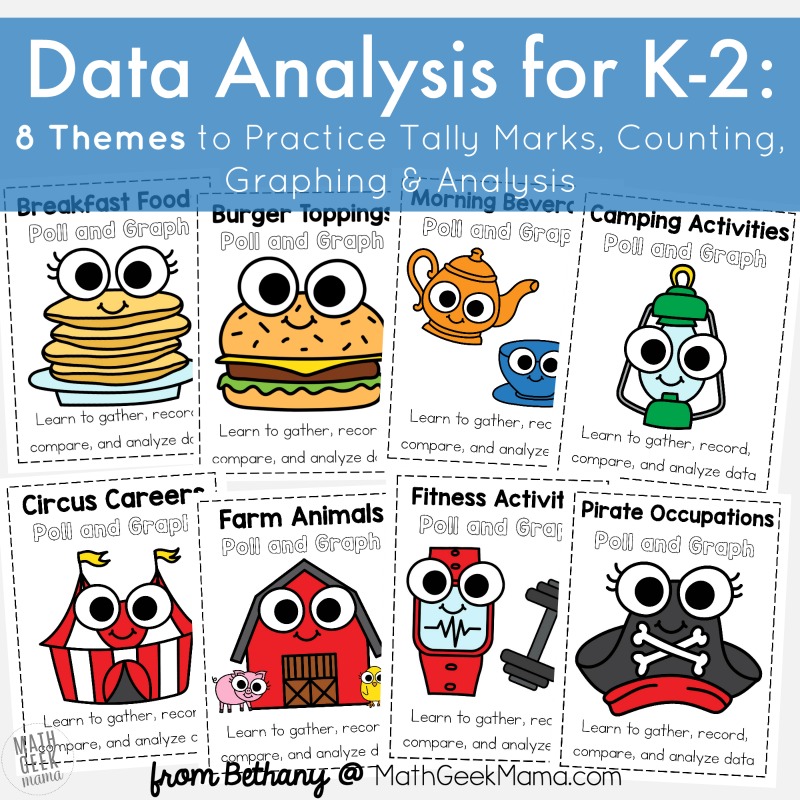
This includes 8 different themes that can be used anytime of the year. Each theme follows the same format as this free sample, but they are all included in one handy dandy download for you.
Buy the K-2 Data Analysis Set HERE!
But of course, you are also welcome to try out the Valentine’s Day data analysis set first for free!
Grab this activity by clicking the link below and grabbing it in my shop. I hope you enjoy it!
One Comment
Comments are closed.