
Fun Probability Experiment with Dice {FREE}
Probability and statistics is such a unique branch of mathematics, and one that can easily cause confusion for students. If you’re looking for a fun and easy way to introduce concepts, you’ll love this probability experiment! It’s part of my Math+Technology Series, and will help kids explore the differences between live, simulated and theoretical probability. All you need is the free probability lesson, a die and your graphing calculator!
*Please Note: This post contains affiliate links which help support the work of this site. Read our full disclosure policy here.*
Combining Technology and Probability
Today I want to share some ways you can use a graphing calculator to analyze data and investigate probability.
Probability can very quickly become overly abstract, causing kids to struggle to make sense of it. Using technology, however, we can help them “see” probability concepts by simulating experiments, or by letting a calculator calculate or graph the results.
This will help students better grasp the difficult abstract principles of probability and statistics, and give them a chance to think through implications on their own.
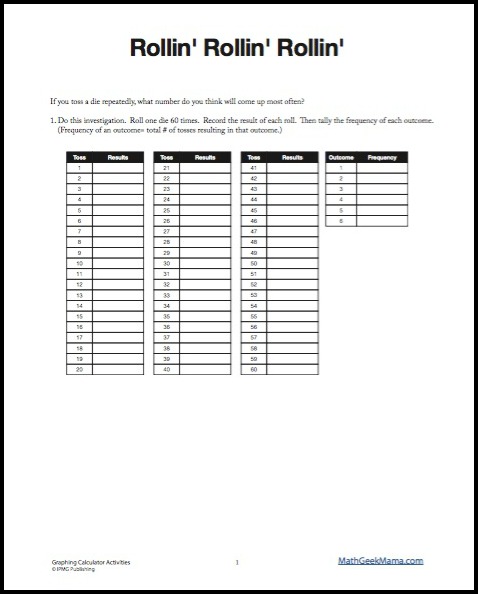
Probability Experiment with Dice
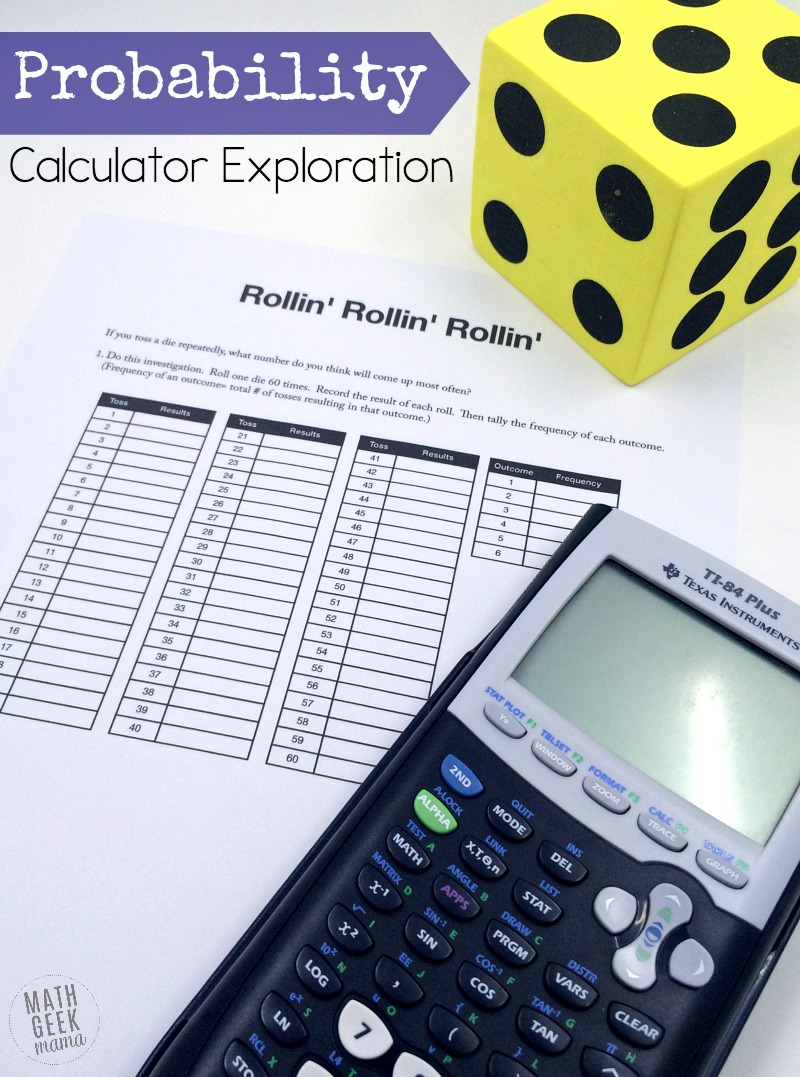
In this free lesson, students are exploring the chances of rolling a certain number on a single die. You may want to begin by having a discussion about it, asking what number they think will come up most frequently, and how they suggest testing their hypothesis.
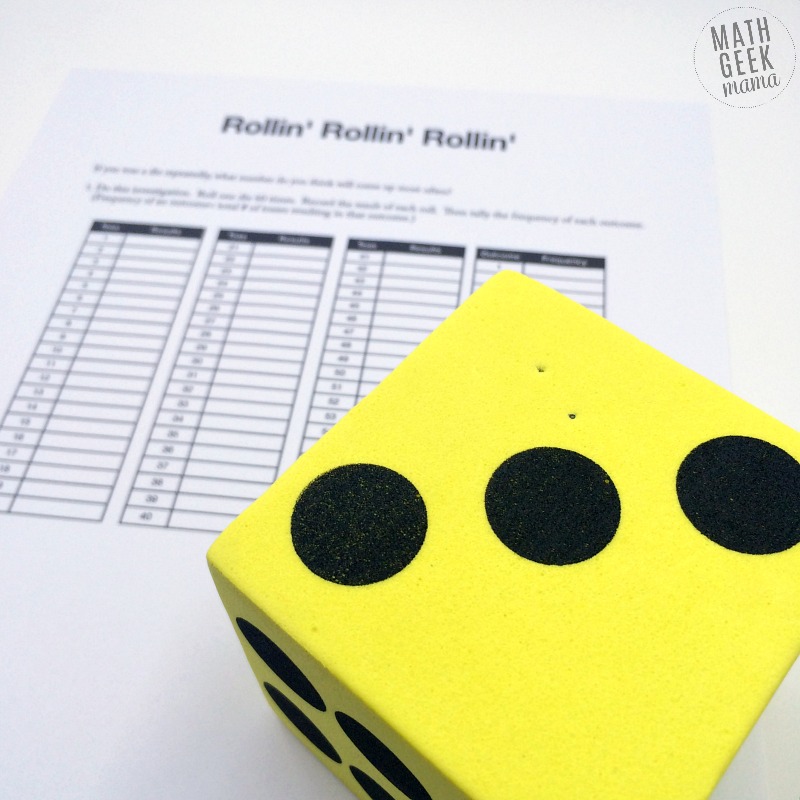
Then students can complete the investigation. They will need a 6-sided die to roll 60 times and then record their results in the table.
I like to use giant foam dice like these, but that’s totally optional. 😉
They then use a graphing calculator to find mean, standard deviation, median, quartiles and range for their data. (Hints are given for how to easily do this with a calculator).
They will also use their calculator to graph the data different ways and analyze the results.
Finally, they will use their calculator to simulate rolling a die, and compare those results to their initial data set.
This is such an interesting investigation, and provides lots of opportunities for math discussions! If students are completing this in groups, you can also compare the data of the different groups to the calculator-simulated results.
Probability Lesson Extensions
A great follow-up activity would be to predict probability for each number when rolling two dice. How do the chances of each number change? You could even use this same set of questions to analyze and compare the probabilities of the numbers 1-12.
{Click HERE to go to my shop and grab the FREE Probability Experiment Handout!}
And don’t miss the rest of the Math+Technology Series:
- Integer Multiplication Patterns with a Calculator
- Exploring Systems of Equations with a Graphing Calculator
- Data Analysis Lesson and Project
- Estimating Area of Circles Investigation
Or if you’d like receive this entire series in your inbox (along with a BONUS lesson), sign up right here!
**Psst! This lesson is a sample from my Graphing Calculator Activities: Probability collection. See the complete collection of lessons here.**